AlgeriAPIs: Access Algerian Data via Public APIs
Source:vignettes/AlgeriAPIs_vignette.Rmd
AlgeriAPIs_vignette.Rmd
library(AlgeriAPIs)
library(ggplot2)
library(dplyr)
#>
#> Attaching package: 'dplyr'
#> The following objects are masked from 'package:stats':
#>
#>     filter, lag
#> The following objects are masked from 'package:base':
#>
#>     intersect, setdiff, setequal, union
Introduction
The AlgeriAPIs package provides a unified interface to
access open data from the World Bank API and the
REST Countries API, with a focus on
Algeria. It allows users to retrieve real-time or
historical information on topics such as economic indicators, population
statistics, and key geopolitical details.
AlgeriAPIs enables users to query data in a reproducible
way and is designed for researchers, analysts, and developers who
require reliable and programmatic access to Algerian data through
established APIs.
Functions for AlgeriAPIs
The AlgeriAPIs package provides several core functions
to access real-time and structured information about
Algeria from public APIs such as the World Bank
API and the REST Countries API.
Below is a list of the main functions included in the package:
get_algeria_child_mortality(): Get Algeria’s Under-5 Mortality Rate data from the World Bank.get_algeria_cpi(): Get Algeria’s Consumer Price Index (2010 = 100) data from the World Bank.get_algeria_energy_use(): Get Algeria’s Energy Use (kg of oil equivalent per capita) data from the World Bank.get_algeria_gdp(): Get Algeria’s GDP (current US$) data from the World Bank.get_algeria_holidays(): Get official public holidays in Algeria for a given year, e.g.,get_algeria_holidays(2025).get_algeria_hospital_beds(): Get Algeria’s Hospital Beds (per 1,000 people) data from the World Bank.get_algeria_literacy_rate(): Get Algeria’s Adult Literacy Rate data from the World Bank.get_algeria_life_expectancy(): Get Algeria’s Life Expectancy at Birth data from the World Bank.get_algeria_population(): Get Algeria’s Total Population data from the World Bank.get_algeria_unemployment(): Get Algeria’s Total Unemployment Rate data from the World Bank.get_country_info_dz(): Get key country information for Algeria.view_datasets_AlgeriAPIs(): View available curated datasets included in AlgeriAPIs.
These functions allow users to access high-quality and structured
information on Algeria, which can be combined with
tools like dplyr and ggplot2 to
support a wide range of data analysis, visualization, and research
tasks. In the following sections, you’ll find examples on how to work
with AlgeriAPIs in practical scenarios.
Algeria’s GDP (Current US$) from World Bank 2022 - 2017
algeria_gdp <- head(get_algeria_gdp())

print(algeria_gdp)
#> # A tibble: 6 × 5
#>   indicator         country  year         value value_label
#>   <chr>             <chr>   <int>         <dbl> <chr>
#> 1 GDP (current US$) Algeria  2022 225638456572. 225,638,456,572
#> 2 GDP (current US$) Algeria  2021 186231205262. 186,231,205,262
#> 3 GDP (current US$) Algeria  2020 164873415325. 164,873,415,325
#> 4 GDP (current US$) Algeria  2019 193459662091. 193,459,662,091
#> 5 GDP (current US$) Algeria  2018 194554483656. 194,554,483,656
#> 6 GDP (current US$) Algeria  2017 189880896903. 189,880,896,903
Algeria’s Life Expectancy at Birth from World Bank 2022 - 2017
algeria_life_expectancy <- head(get_algeria_life_expectancy())

print(algeria_life_expectancy)
#> # A tibble: 6 × 4
#>   indicator                               country  year value
#>   <chr>                                   <chr>   <int> <dbl>
#> 1 Life expectancy at birth, total (years) Algeria  2022  76.1
#> 2 Life expectancy at birth, total (years) Algeria  2021  75.2
#> 3 Life expectancy at birth, total (years) Algeria  2020  73.3
#> 4 Life expectancy at birth, total (years) Algeria  2019  75.7
#> 5 Life expectancy at birth, total (years) Algeria  2018  75.6
#> 6 Life expectancy at birth, total (years) Algeria  2017  75.4
Algeria’s Total Population from World Bank 2022 - 2017
algeria_population <- head(get_algeria_population())
print(algeria_population)
#> # A tibble: 6 × 5
#> indicator country year value value_label
#> <chr> <chr> <int> <int> <chr>
#> 1 Population, total Algeria 2022 45477389 45,477,389
#> 2 Population, total Algeria 2021 44761099 44,761,099
#> 3 Population, total Algeria 2020 44042091 44,042,091
#> 4 Population, total Algeria 2019 43294546 43,294,546
#> 5 Population, total Algeria 2018 42505035 42,505,035
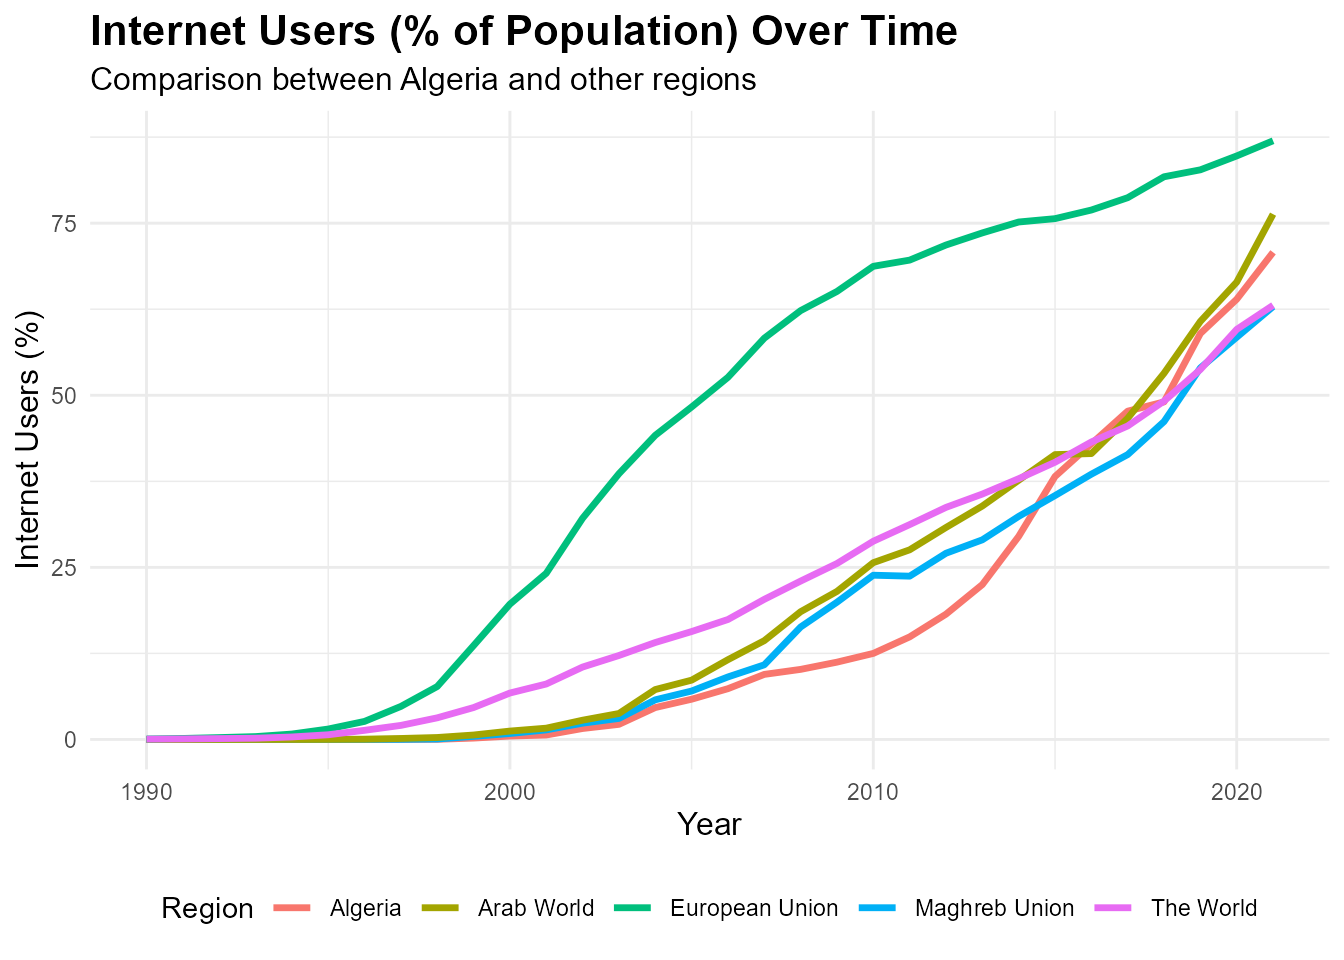
#> 6 Population, total Algeria 2017 41689299 41,689,299Internet Users (% of Population) Over Time
# Simple line plot using only ggplot2 and dplyr
ggplot(internet_users_tbl_df, aes(x = Year)) +
  geom_line(aes(y = Algeria, color = "Algeria"), size = 1.2) +
  geom_line(aes(y = Maghreb_union, color = "Maghreb Union"), size = 1.2) +
  geom_line(aes(y = Arab_world, color = "Arab World"), size = 1.2) +
  geom_line(aes(y = European_Union, color = "European Union"), size = 1.2) +
  geom_line(aes(y = The_World, color = "The World"), size = 1.2) +
  labs(
    title = "Internet Users (% of Population) Over Time",
    subtitle = "Comparison between Algeria and other regions",
    x = "Year",
    y = "Internet Users (%)",
    color = "Region"
  ) +
  theme_minimal() +
  theme(
    plot.title = element_text(face = "bold", size = 16),
    plot.subtitle = element_text(size = 12),
    axis.title = element_text(size = 12),
    legend.position = "bottom"
  )
Dataset Suffixes
Each dataset in AlgeriAPIs is labeled with a
suffix to indicate its structure and type:
_df: A standard data frame._tbl_df: A tibble data frame object.
Datasets Included in AlgeriAPIs
In addition to API access functions, AlgeriAPIs offers
curated open datasets focused on Algeria, with only two
datasets included in this first version (algiers_temp_df
and internet_users_tbl_df), and many more to be added in
future updates.
Below are some featured examples:
algiers_temp_df: A data frame containing daily maximum and minimum air temperature records for Algiers, Algeria.
internet_users_tbl_df: A tibble containing the percentage of Internet users in Algeria and comparative data for regional and global contexts.
Conclusion
The AlgeriAPIs package provides a reliable and
reproducible way to access data from public RESTful APIs, including the
World Bank API and the REST Countries
API, focusing on Algeria. It enables users to
retrieve real-time or historical information on economic indicators,
demographic statistics, and key geopolitical data.
Designed for researchers, analysts, and developers,
AlgeriAPIs facilitates programmatic access to Algerian
data, making it easier to integrate this information into analyses,
reports, and applications.