educationR: A Comprehensive Collection of Educational Datasets
Source:vignettes/Introduction_to_educationR.Rmd
Introduction_to_educationR.Rmd
library(educationR)

library(ggplot2)

library(dplyr)
#>
#> Attaching package: 'dplyr'
#> The following objects are masked from 'package:stats':
#>
#>     filter, lag
#> The following objects are masked from 'package:base':
#>
#>     intersect, setdiff, setequal, union
Introduction
The educationR package provides a comprehensive
collection of educational datasets, focusing on various aspects of
education such as student performance, learning methods, test scores,
absenteeism, and other educational metrics. This package is
designed to serve as a resource for educational researchers, data
analysts, and statisticians who wish to explore and analyze data in the
field of education.
The datasets in the educationR package have been
carefully curated and are ready to use for your data analysis needs.
Dataset Suffixes
Each dataset in the educationR package comes with a
suffix that indicates the type and format of the dataset. These suffixes
help users quickly identify the structure of the data, such as:
-
tbl_df: A tibble (a modern version of a data frame in R) -
df: A standard data frame -
table: A table (used for contingency tables or cross-tabulations)
Example Datasets
Below are some examples of datasets included in the
educationR package:
Achieve_tbl_df: A tibble containing math achievement test scores by gender.German_tbl_df: A tibble documenting before-and-after German copying errors post-course.QuizPulse10_df: A data frame comparing quiz scores with lecture pulse rates.UCBAdmissions_table: A table documenting student admissions at UC Berkeley.
Data Visualization with educationR data sets
Here are a couple of examples of how to use educationR
package datasets to create data visualizations related to educational
matters:
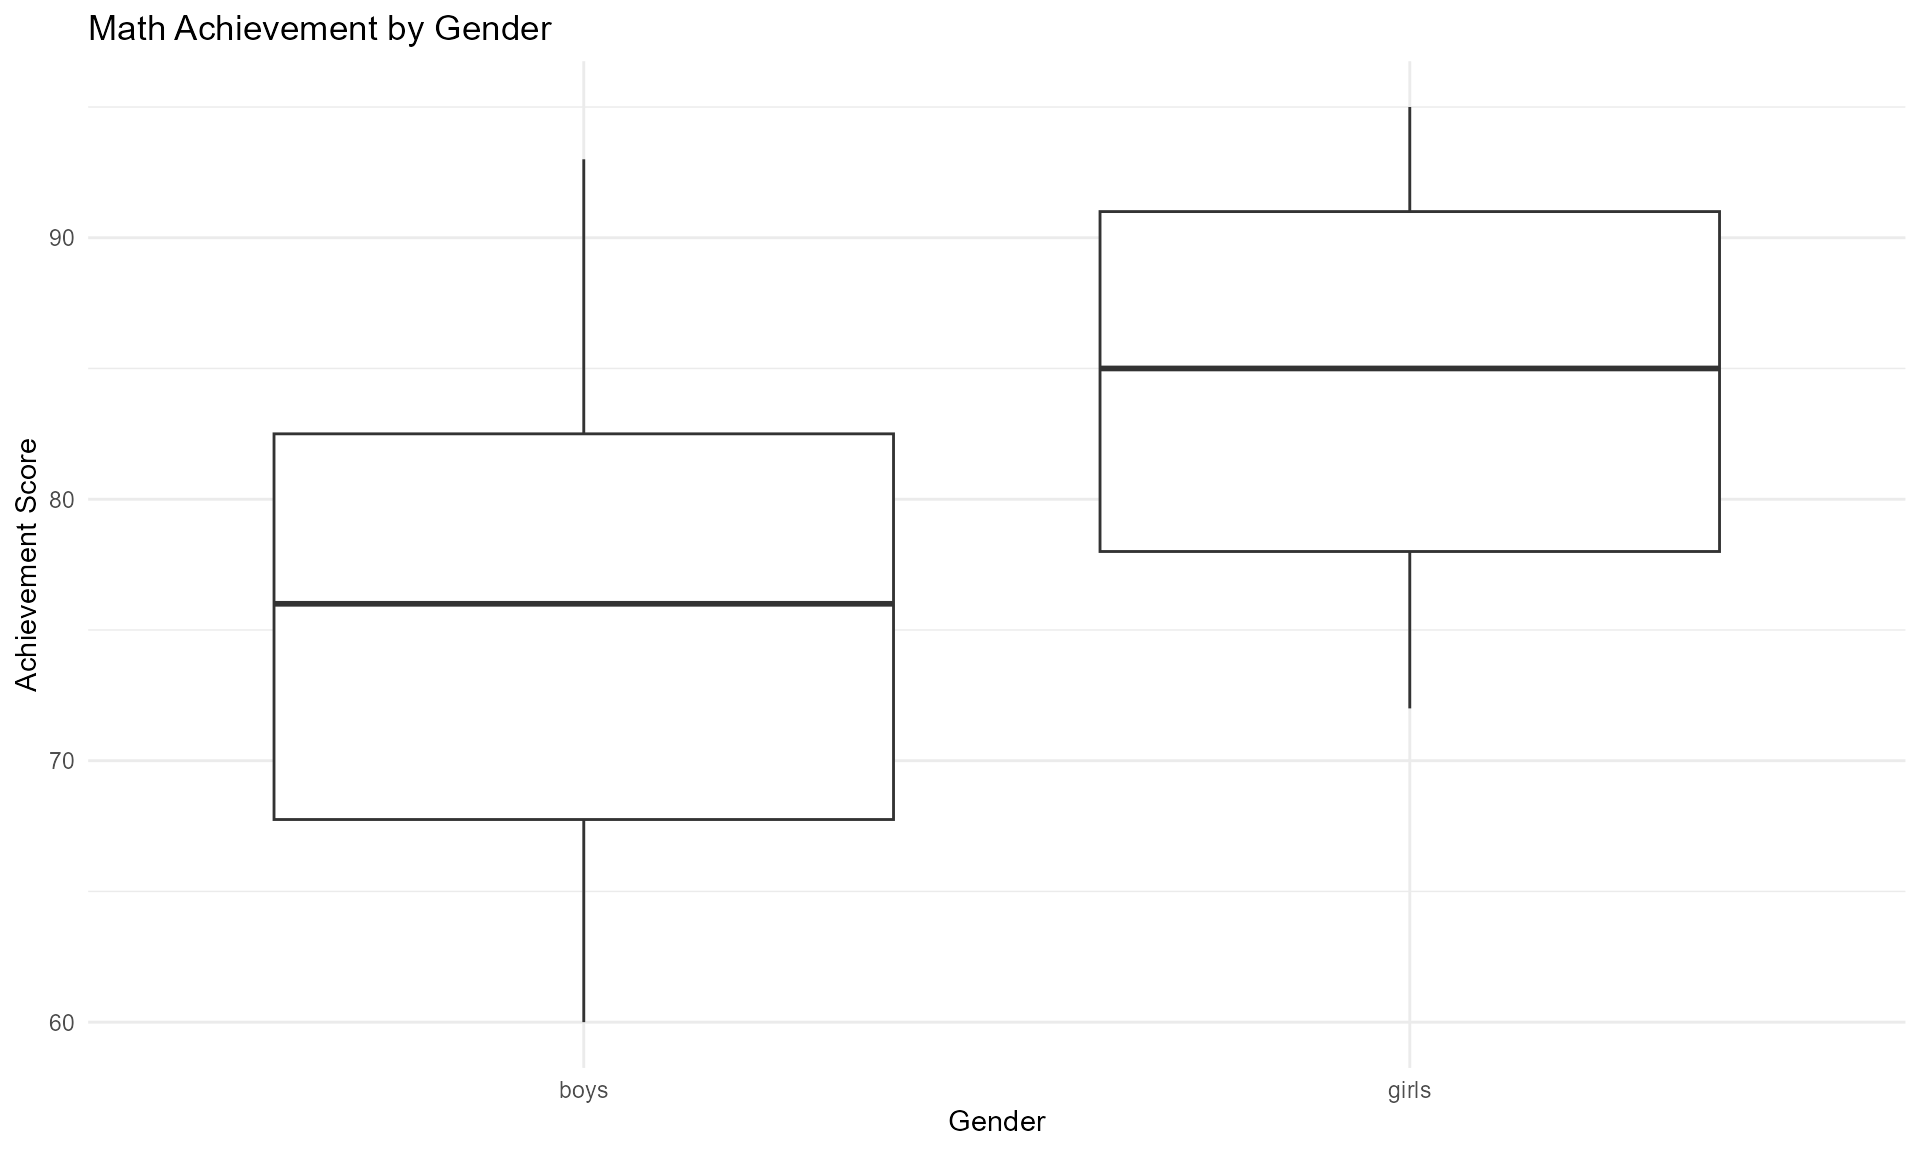
1. Visualization of Math Achievement by Gender
# Example: Visualizing math achievement by gender
Achieve_tbl_df %>%
  ggplot(aes(x = gender, y = score)) +
  geom_boxplot() +
  labs(title = "Math Achievement by Gender",
       x = "Gender",
       y = "Achievement Score") +
  theme_minimal()
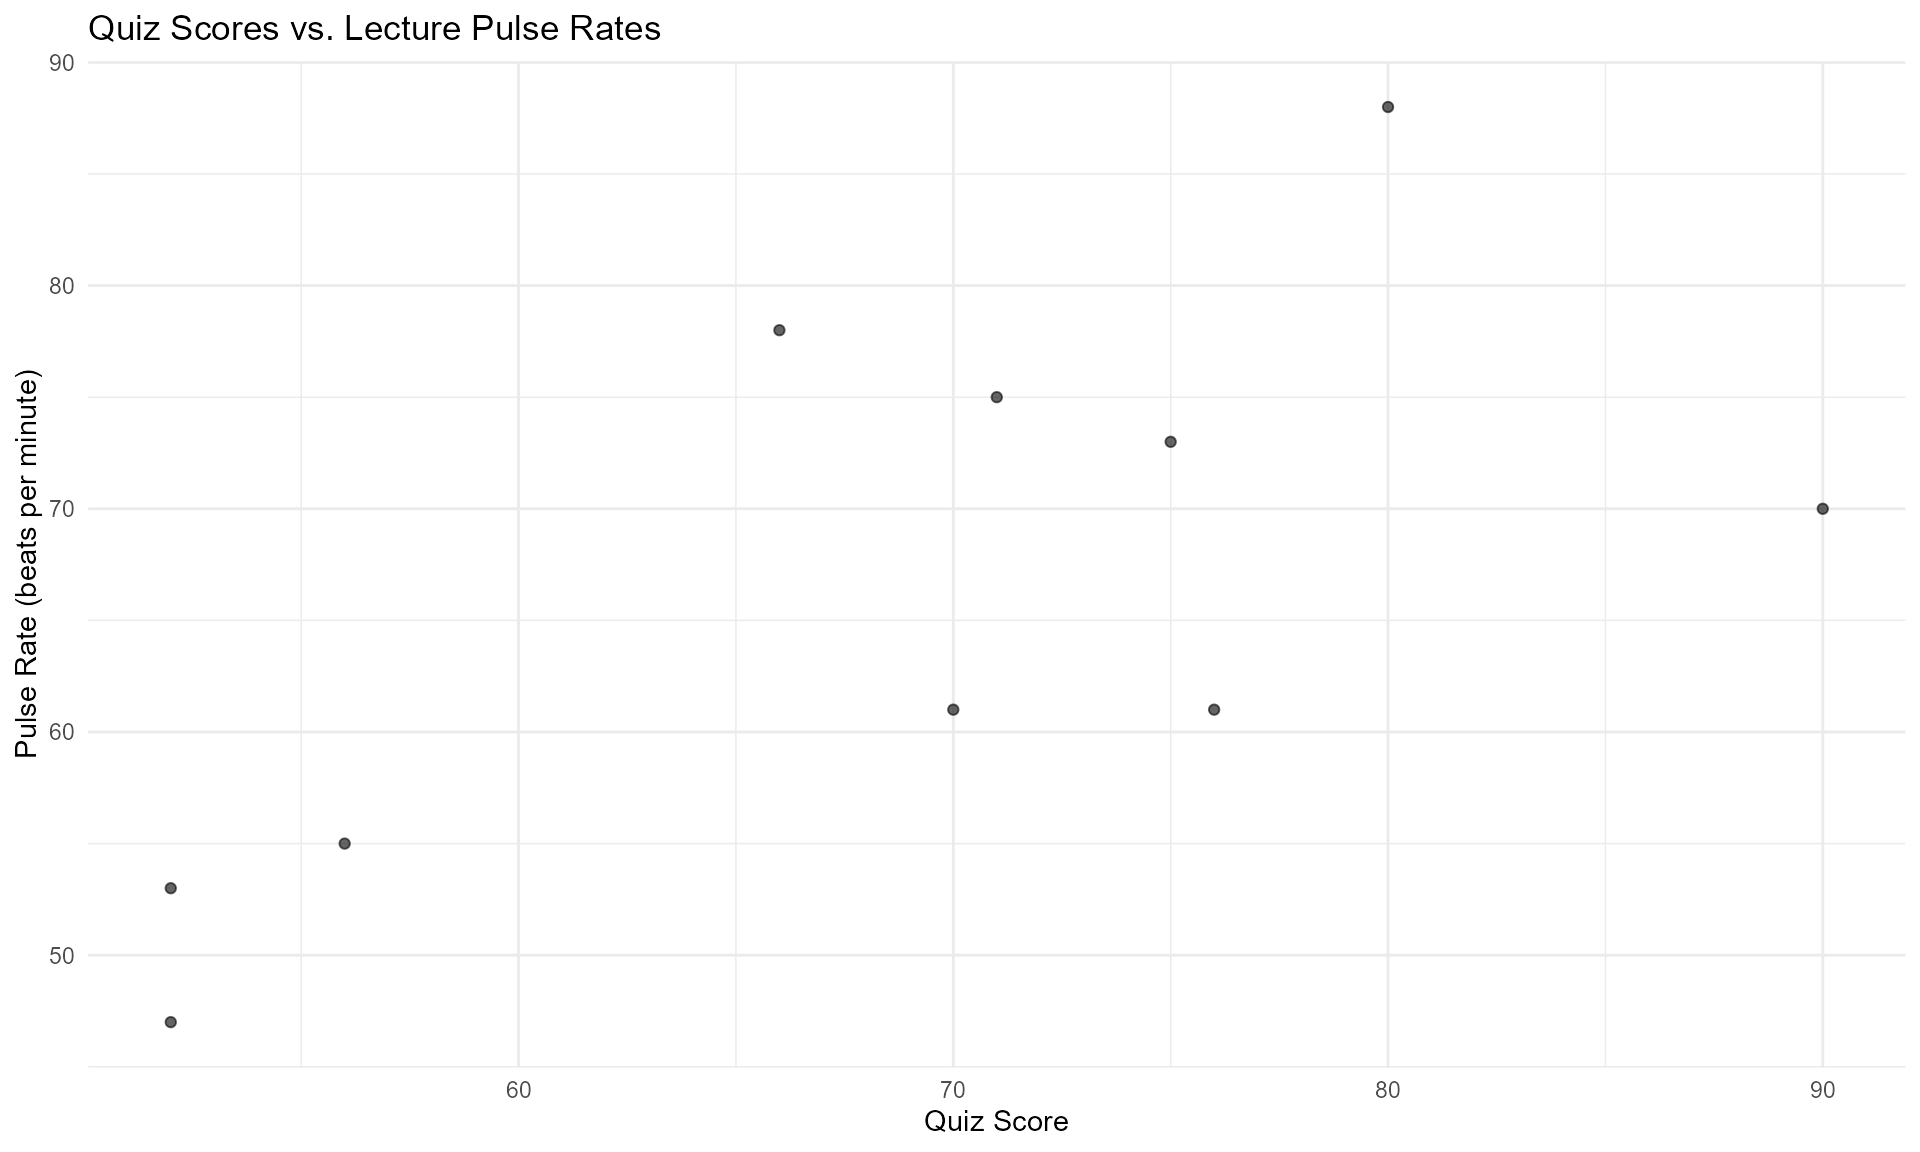
2. Visualization of Quiz Scores vs. Lecture Pulse Rates
# Example: Visualizing the relationship between quiz scores and lecture pulse rates
QuizPulse10_df %>%
  ggplot(aes(x = Quiz, y = Lecture)) +
  geom_point(alpha = 0.6) +
  labs(title = "Quiz Scores vs. Lecture Pulse Rates",
       x = "Quiz Score",
       y = "Pulse Rate (beats per minute)") +
  theme_minimal()
Conclusion
The educationR package provides a wealth of educational
data for analysis. By using the dataset suffixes, users can quickly
identify the type of data they are working with, ensuring a smooth
analysis process.
For more information on each dataset and further examples, please refer to the full package documentation.