NeuroDataSets: A Comprehensive Collection of Neuroscience and Brain-Related Datasets
Source:vignettes/introduction_to_neurodatasets.Rmd
introduction_to_neurodatasets.Rmd
library(NeuroDataSets)
library(dplyr)
#>
#> Attaching package: 'dplyr'
#> The following objects are masked from 'package:stats':
#>
#>     filter, lag
#> The following objects are masked from 'package:base':
#>
#>     intersect, setdiff, setequal, union
library(ggplot2)
Introduction
The NeuroDataSets package offers a rich and diverse
collection of datasets focused on the brain, the nervous system, and
neurological and psychiatric disorders. It includes comprehensive data
on conditions such as Parkinson’s disease, Alzheimer’s disease,
dementia, epilepsy, schizophrenia, autism spectrum disorder, attention
deficit hyperactivity disorder (ADHD), Tourette’s syndrome, traumatic
brain injury, gliomas, migraines, headaches, sleep disorders,
concussions, encephalitis, subarachnoid hemorrhage, and mental health
conditions.
The package contains a wide variety of data types, including clinical, experimental, neuroimaging, behavioral, cognitive, and simulated datasets. These datasets encompass structural and functional brain data, cross-sectional and longitudinal MRI imaging studies, neurotransmission metrics, gene expression profiles, cognitive performance assessments, intelligence metrics, sleep deprivation effects, treatment outcomes, brain-body relationships across species, neurological injury patterns, and acupuncture interventions.
Designed for researchers, neuroscientists, clinicians, psychologists, data scientists, and students, this package facilitates exploratory data analysis, statistical modeling, machine learning applications, and hypothesis testing in neuroscience and neuroepidemiology.
All datasets within NeuroDataSets
view_datasets_NeuroDataSets()
#>  [1] "ADHD_df"                     "AD_biomarkers_tbl_df"
#>  [3] "ASD_risks_tbl_df"            "DA_schizophrenia_tbl_df"
#>  [5] "OASIS_cross_tbl_df"          "OASIS_long_tbl_df"
#>  [7] "SAHemorrhage_df"             "TBI_age_tbl_df"
#>  [9] "TBI_military_tbl_df"         "TBI_steroids_df"
#> [11] "WMpatterns_tbl_df"           "aba_phenotype_data_df"
#> [13] "ability_intelligence_list"   "acupuncture_df"
#> [15] "adolescent_mental_health_df" "alzheimer_smoking_df"
#> [17] "bilingual_brains_df"         "blood_brain_barrier_df"
#> [19] "brain_litter_mammals_df"     "brain_size_iq_df"
#> [21] "brain_string_players_df"     "brainexpression_df"
#> [23] "brains_cognitive_matrix"     "brainvolume_df"
#> [25] "cerebellar_age_df"           "chimpbrains_df"
#> [27] "cocaine_dopamine_df"         "dementia_df"
#> [29] "encephalitis_df"             "epilepsy_RCT_tbl_df"
#> [31] "epilepsy_drug_qol_df"        "epilepsy_drug_trial_df"
#> [33] "gm_expected_patterns_tbl_df" "guineapig_neuro_df"
#> [35] "hippocampus_lesions_df"      "iq_country_tbl_df"
#> [37] "mammals_brain_body_df"       "markers_brain_df"
#> [39] "markers_human_brain_df"      "markers_mouse_brain_df"
#> [41] "migraine_treatment_df"       "migraines_df"
#> [43] "migrane_dose_df"             "neanderthal_brains_df"
#> [45] "neuro_pointprocess_matrix"   "neurodeg_dose_df"
#> [47] "nfl_concussions_tbl_df"      "parkinsons_dopamine_list"
#> [49] "pediatric_glioma_tbl_df"     "psych_neurocog_df"
#> [51] "sleep_deprivation_tbl_df"    "sleep_disorder_df"
#> [53] "sleep_performance_df"        "subcortical_patterns_tbl_df"
#> [55] "tourette_ADHD_df"
Dataset Suffixes
Each dataset in the NeuroDataSets package uses a
suffix to denote the type of R object:
_df: A data frame_list: A list_tbl_df: A tibble_matrix: A matrix
Example Datasets
Below are selected example datasets included in the
NeuroDataSets package:
subcortical_patterns_tbl_df: Patterns of Subcortical Structures.WMpatterns_tbl_df: Expected Patterns of White Matter.hippocampus_lesions_df: Memory and the Hippocampus.
Data Visualization with NeuroDataSets Data
Patterns of Subcortical Structures
# Convert the dataset to long format using only base R + dplyr

long_data <- subcortical_patterns_tbl_df %>%
  select(Subcortical, everything()) %>%
  as.data.frame() %>%
  reshape(
    varying = names(.)[-1],
    v.names = "Value",
    timevar = "Condition",
    times = names(.)[-1],
    direction = "long"
  ) %>%
  select(Subcortical, Condition, Value)

# Create a heatmap
ggplot(long_data, aes(x = Condition, y = Subcortical, fill = Value)) +
  geom_tile(color = "white") +
  scale_fill_gradient(low = "lightblue", high = "darkred") +
  labs(
    title = "Subcortical Patterns by Condition",
    x = "Condition",
    y = "Subcortical Region",
    fill = "Value"
  ) +
  theme_minimal() +
  theme(axis.text.x = element_text(angle = 45, hjust = 1))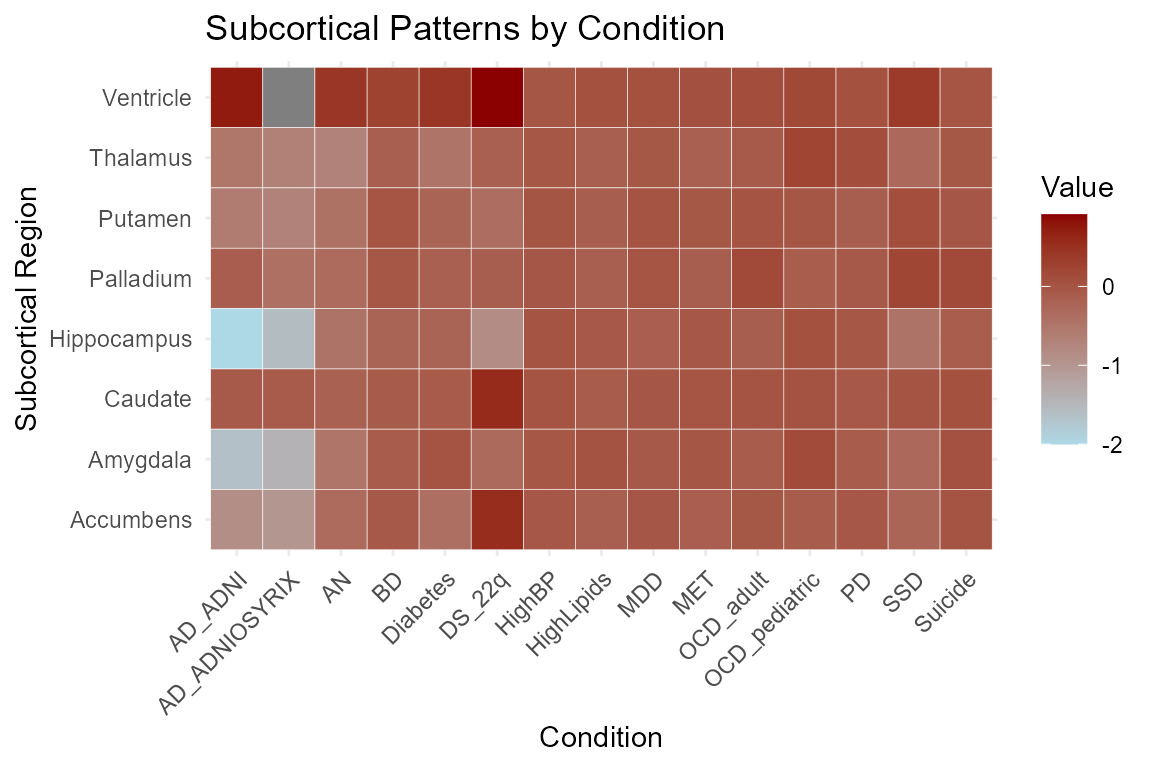
Expected Patterns of White Matter
# Compute mean values using updated anonymous function syntax
summary_data <- WMpatterns_tbl_df %>%
  select(-WM) %>%
  summarise(across(everything(), \(x) mean(x, na.rm = TRUE))) %>%
  as.data.frame()

# Reshape from wide to long format using base R
summary_data <- data.frame(
  Condition = names(summary_data),
  MeanValue = as.numeric(summary_data[1, ])
)

# Plot
ggplot(summary_data, aes(x = Condition, y = MeanValue, fill = Condition)) +
  geom_bar(stat = "identity") +
  labs(
    title = "Average Value per Condition across White Matter Regions",
    x = "Condition",
    y = "Mean Value"
  ) +
  theme_minimal() +
  theme(axis.text.x = element_text(angle = 45, hjust = 1)) +
  guides(fill = "none")  # Optional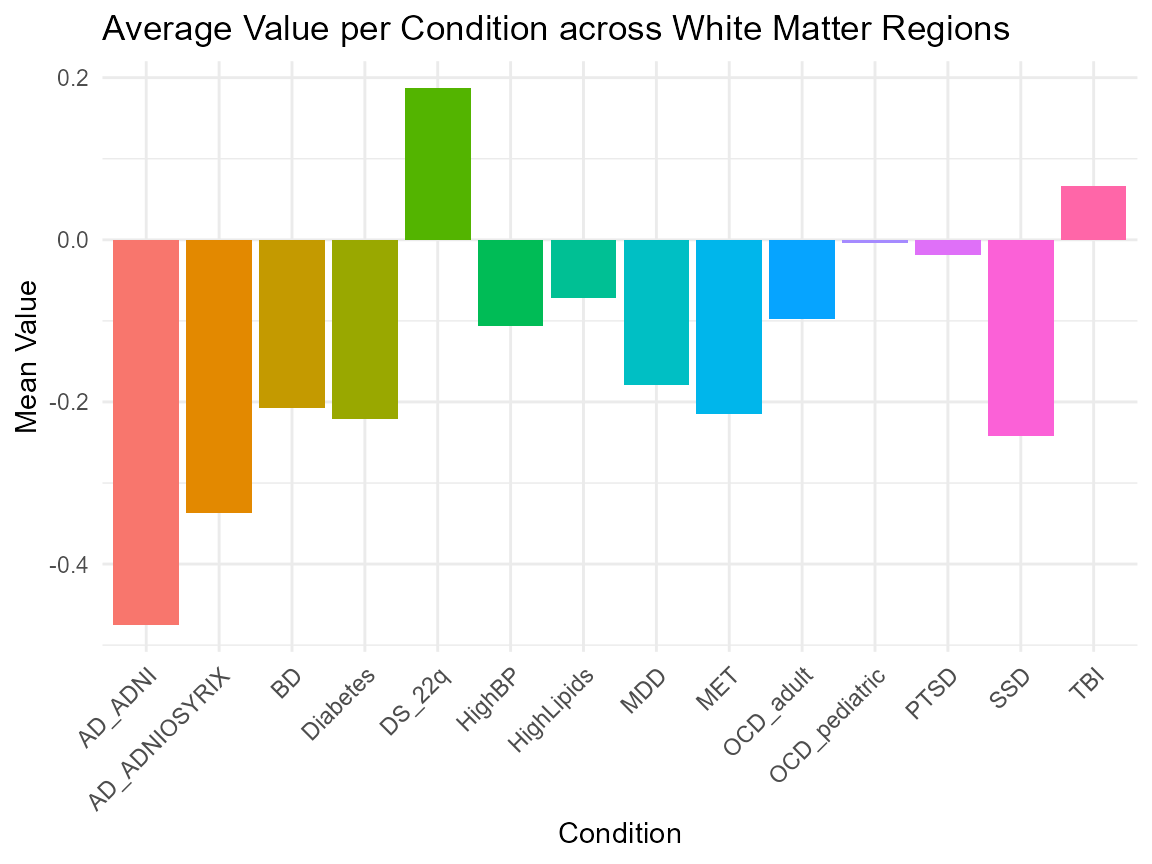
Memory and the Hippocampus
# Lesion Size and Memory Score

ggplot(hippocampus_lesions_df, aes(x = lesion, y = memory)) +
  geom_point(color = "blue", size = 2) +
  labs(
    title = "Relationship Between Lesion Size and Memory Score",
    x = "Lesion Size",
    y = "Memory Score"
  ) +
  theme_minimal()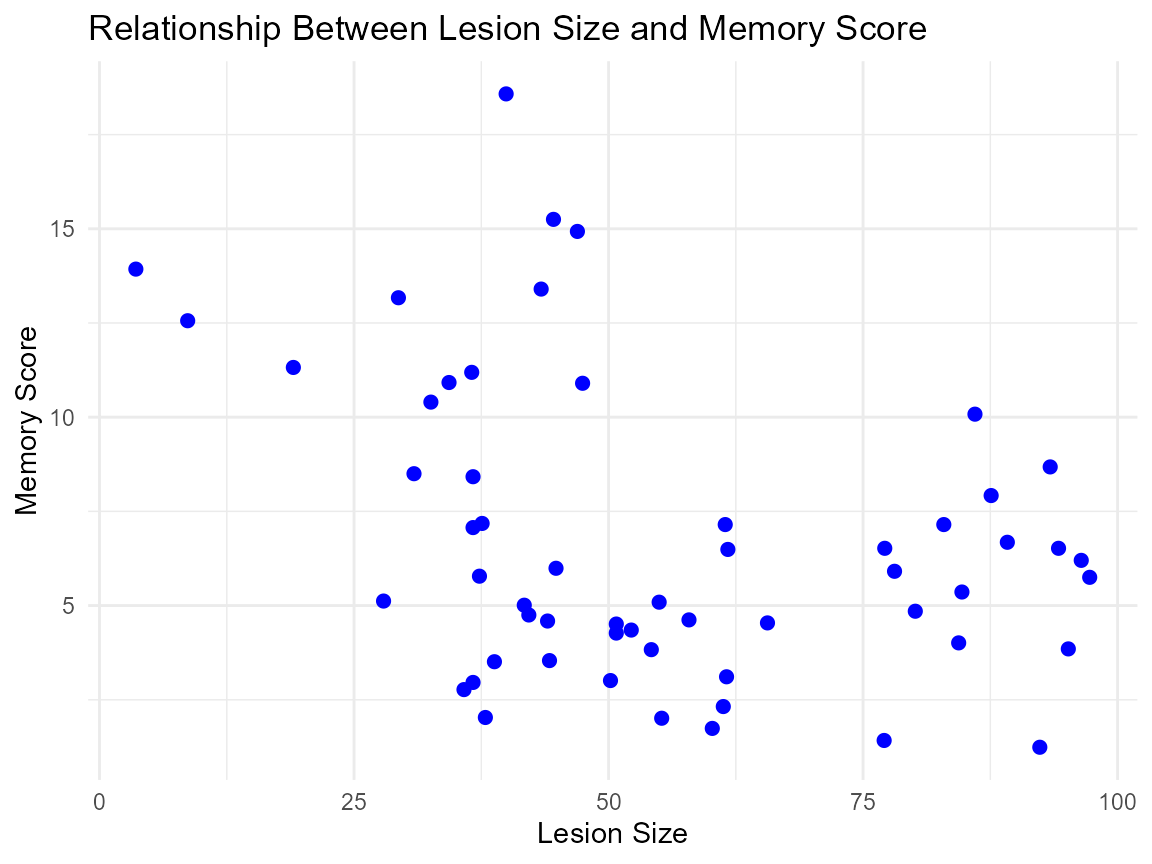
Conclusion
The NeuroDataSets package offers a comprehensive and
curated collection of datasets spanning a wide spectrum of neurological,
psychiatric, and cognitive conditions. By integrating data from clinical
trials, peer-reviewed research, military health records, sports injury
databases, and international comparative studies, this package provides
researchers with robust resources for cutting-edge neuroscience
research.
Whether you are conducting exploratory data analysis, building
predictive models, testing statistical hypotheses, or teaching
neuroepidemiology and data science, NeuroDataSets delivers
well-structured, documented, and diverse datasets that reflect the
complexity of brain function, neurological disorders, and their
treatments.
For detailed information and full documentation of each dataset, including variable descriptions, data sources, and usage examples, please refer to the reference manual and help files included within the package.