PeruAPIs: Access Peruvian Data via Public APIs and Curated Datasets
Source:vignettes/PeruAPIs_vignette.Rmd
PeruAPIs_vignette.Rmd
library(PeruAPIs)
library(ggplot2)
library(dplyr)
#>
#> Attaching package: 'dplyr'
#> The following objects are masked from 'package:stats':
#>
#>     filter, lag
#> The following objects are masked from 'package:base':
#>
#>     intersect, setdiff, setequal, union
Introduction
The PeruAPIs package provides a unified interface to
access open data from the World Bank API,
Nager.Date API, and the REST Countries
API, with a focus on Peru. It allows users to
retrieve up-to-date or historical information on topics such as economic
indicators, demographics, national holidays, and key geopolitical
details.
In addition to API-access functions, the package includes a curated collection of open datasets related to Peru. These datasets cover a wide range of topics including administrative divisions, electoral data, demographics, biodiversity and educational classifications.
PeruAPIs is designed to support users working with data
related to Peru by integrating international RESTful
APIs with structured and reliable datasets from public, academic, and
government sources into a single, easy-to-use R package. This makes the
package a valuable tool for reproducible research, teaching, and
policy analysis.
Functions for PeruAPIs
The PeruAPIs package provides several core functions to
access real-time and structured information about Peru
from public APIs such as the World Bank API,
Nager.Date, and the REST Countries
API.
Below is a list of the main functions included in the package:
get_peru_child_mortality(): Get Peru’s Under-5 Mortality Rate data from the World Bank.get_peru_cpi(): Get Peru’s Consumer Price Index (2010 = 100) data from the World Bank.get_peru_energy_use(): Get Peru’s Energy Use (kg of oil equivalent per capita) data from the World Bank.get_peru_gdp(): Get Peru’s GDP (current US$) data from the World Bank.get_peru_holidays(): Get official public holidays in Peru for a given year, e.g.,get_peru_holidays(2025).get_peru_hospital_beds(): Get Peru’s Hospital Beds (per 1,000 people) data from the World Bank.get_peru_literacy_rate(): Get Peru’s Adult Literacy Rate data from the World Bank.get_peru_life_expectancy(): Get Peru’s Life Expectancy at Birth data from the World Bank.get_peru_population(): Get Peru’s Total Population data from the World Bank.get_peru_unemployment(): Get Peru’s Total Unemployment Rate data from the World Bank.get_country_info_pe(): Get key country information for Peru.view_datasets_PeruAPIs(): View available curated datasets included in PeruAPIs.
These functions allow users to access high-quality and structured
information on Peru, which can be combined with tools
like dplyr and ggplot2 to support a
wide range of data analysis, visualization, and research tasks. In the
following sections, you’ll find examples on how to work with
PeruAPIs in practical scenarios.
Peru’s GDP (Current US$) from World Bank 2022 - 2017
peru_gdp <- head(get_peru_gdp())

print(peru_gdp)
#> # A tibble: 6 × 5
#>   indicator         country  year         value value_label
#>   <chr>             <chr>   <int>         <dbl> <chr>
#> 1 GDP (current US$) Peru     2022 246065570308. 246,065,570,308
#> 2 GDP (current US$) Peru     2021 226328766460. 226,328,766,460
#> 3 GDP (current US$) Peru     2020 201409694756. 201,409,694,756
#> 4 GDP (current US$) Peru     2019 228346006004. 228,346,006,004
#> 5 GDP (current US$) Peru     2018 222597009739. 222,597,009,739
#> 6 GDP (current US$) Peru     2017 211007984081. 211,007,984,081
Peru’s Life Expectancy at Birth from World Bank 2022 - 2017
peru_life_expectancy <- head(get_peru_life_expectancy())

print(peru_life_expectancy)
#> # A tibble: 6 × 4
#>   indicator                               country  year value
#>   <chr>                                   <chr>   <int> <dbl>
#> 1 Life expectancy at birth, total (years) Peru     2022  76.8
#> 2 Life expectancy at birth, total (years) Peru     2021  71.6
#> 3 Life expectancy at birth, total (years) Peru     2020  73.8
#> 4 Life expectancy at birth, total (years) Peru     2019  76.3
#> 5 Life expectancy at birth, total (years) Peru     2018  76.0
#> 6 Life expectancy at birth, total (years) Peru     2017  76.0
Peru’s Total Population from World Bank 2022 - 2017
peru_population <- head(get_peru_population())

print(peru_population)
#> # A tibble: 6 × 5
#>   indicator         country  year    value value_label
#>   <chr>             <chr>   <int>    <int> <chr>
#> 1 Population, total Peru     2022 33475438 33,475,438
#> 2 Population, total Peru     2021 33155882 33,155,882
#> 3 Population, total Peru     2020 32838579 32,838,579
#> 4 Population, total Peru     2019 32449303 32,449,303
#> 5 Population, total Peru     2018 31897584 31,897,584
#> 6 Population, total Peru     2017 31324637 31,324,637
Relationship between Blank Votes and Human Development Index in Peru
# Example of scatter plot: Relationship between Blank Votes and HDI
peru_blank_votes_df %>%
  ggplot(aes(x = votes, y = HDI)) +
  geom_point(color = "steelblue", alpha = 0.7) +
  geom_smooth(method = "lm", se = TRUE, color = "darkred", linetype = "dashed") +
  labs(
    title = "Relationship between Blank Votes and Human Development Index (HDI) in Peru",
    x = "Proportion of Blank Votes",
    y = "Human Development Index (HDI)"
  ) +
  theme_minimal()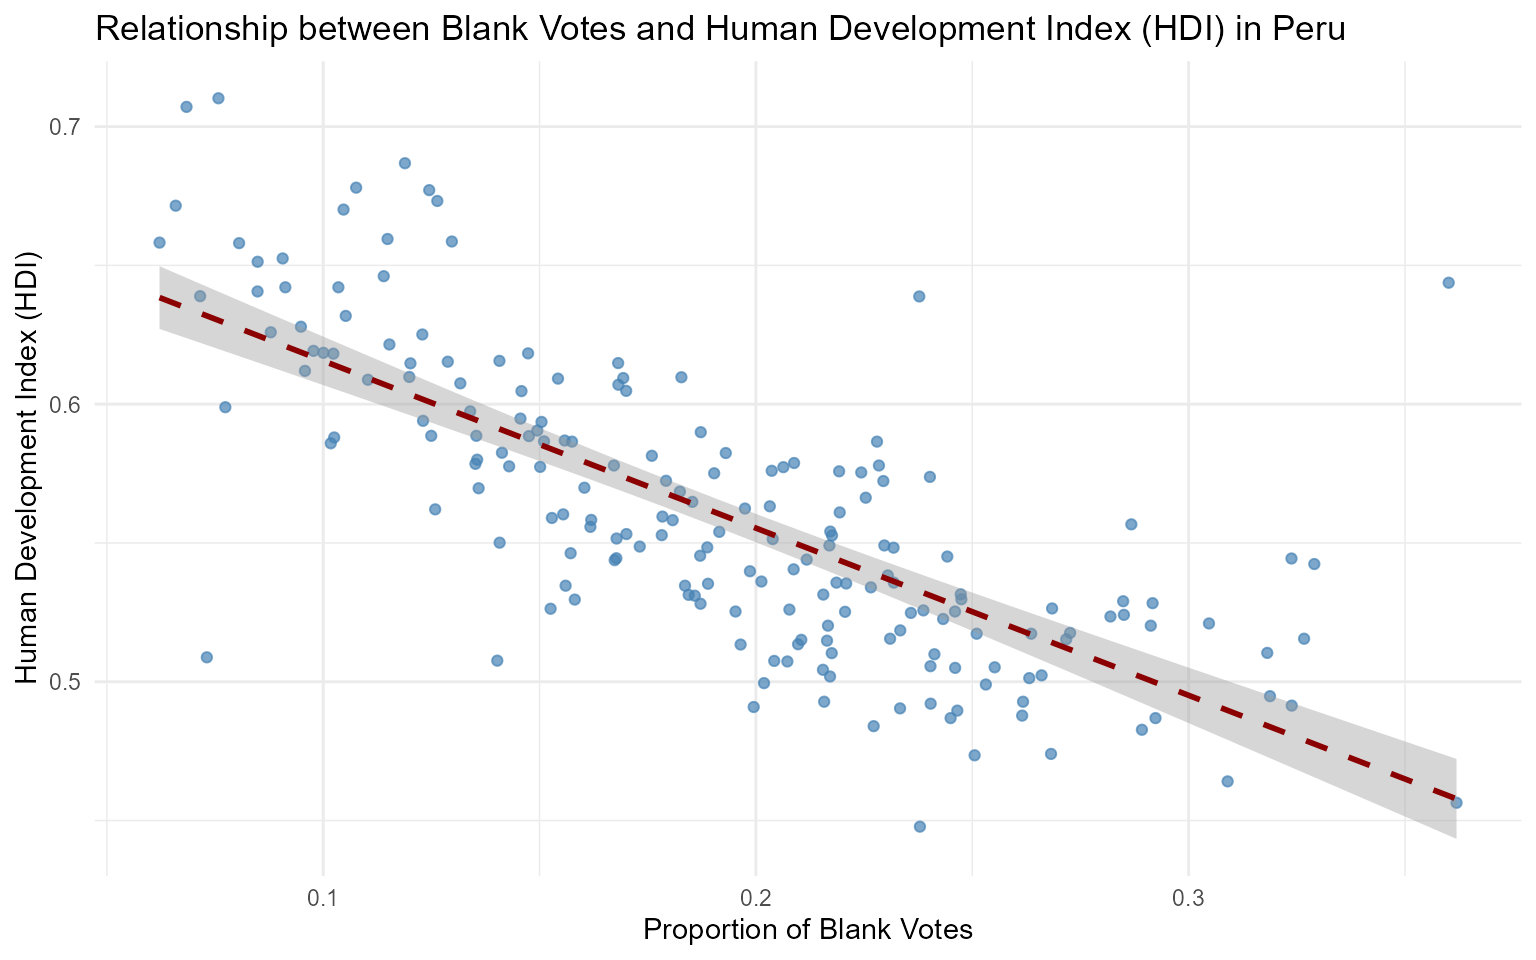
Dataset Suffixes
Each dataset in PeruAPIs is labeled with a
suffix to indicate its structure and type:
_df: A standard data frame._tbl_df: A tibble data frame object.
Datasets Included in PeruAPIs
In addition to API access functions, PeruAPIs provides a
curated collection of open datasets focused on Peru.
These preloaded datasets cover a wide range of topics including
administrative divisions, electoral data, demographics, biodiversity,
coastal geography, and educational classifications. The package supports
reproducible research and teaching by integrating reliable international
APIs with structured datasets from public, academic, and government
sources.
Below are some featured examples:
andean_migrants_health_df: A data frame containing health data from a random sample of Peruvians born in the Andes mountains, but who have since migrated to lower altitudes.
birds_peru_tbl_df: A tibble containing an updated list of bird species recorded in Peru, based on the most recent taxonomic revisions by the South American.
Conclusion
The PeruAPIs package offers a unified interface for
accessing both real-time data from public APIs and a curated collection
of structured datasets about Peru. Covering a wide
range of topics from economic indicators, public holidays, and
demographic statistics via international APIs, to detailed datasets on
administrative divisions, elections, biodiversity and education,
PeruAPIs provides users with reliable, structured, and
high-quality data.
Unlike tools that focus exclusively on API access,
PeruAPIs integrates curated datasets that enrich the
analytical possibilities, enabling a deeper exploration of Peru’s
historical, social, environmental, and economic landscape.
Designed to support reproducible research, education, policy analysis, and data journalism, the package empowers users to analyze and visualize Peru-focused data directly within R, leveraging tidy data formats, international APIs, and well-documented local datasets.