SouthKoreAPIs: Access South Korean Data via Public APIs and Curated Datasets
Source:vignettes/SouthKoreAPIs_vignette.Rmd
SouthKoreAPIs_vignette.Rmd
library(SouthKoreAPIs)
library(dplyr)
#>
#> Attaching package: 'dplyr'
#> The following objects are masked from 'package:stats':
#>
#>     filter, lag
#> The following objects are masked from 'package:base':
#>
#>     intersect, setdiff, setequal, union
library(ggplot2)
Introduction
The SouthKoreAPIs package provides a unified interface
to access open data from the World Bank API,
Nager.Date API, and the REST Countries
API, with a focus on South Korea. It allows
users to retrieve up-to-date or historical information on topics such as
economic indicators, population statistics, national holidays, and key
geopolitical details.
In addition to API-access functions, the package includes one of the largest curated collections of open datasets related to South Korea. These datasets cover a wide range of topics including public health outbreaks, demographics, social surveys, elections, economic indicators, natural disasters, administrative divisions, air quality, climate data, energy consumption, cultural information, and financial markets.
SouthKoreAPIs is designed to support users working with
data related to South Korea by integrating
international RESTful APIs with structured and reliable datasets from
public, academic, and government sources into a single, easy-to-use R
package.
Functions for SouthKoreAPIs
The SouthKoreAPIs package provides several core
functions to access real-time and structured information about
South Korea from public APIs such as the World
Bank API, Nager.Date, and the REST
Countries API.
Below is a list of the main functions included in the package:
get_southkorea_child_mortality(): Get South Korea’s Under-5 Mortality Rate data from the World Bank.get_southkorea_cpi(): Get South Korea’s Consumer Price Index (2010 = 100) data from the World Bank.get_southkorea_energy_use(): Get South Korea’s Energy Use (kg of oil equivalent per capita) data from the World Bank.get_southkorea_gdp(): Get South Korea’s GDP (current US$) data from the World Bank.get_southkorea_holidays(): Get official public holidays in South Korea for a given year, e.g.,get_southkorea_holidays(2025).get_southkorea_hospital_beds(): Get South Korea’s Hospital Beds (per 1,000 people) data from the World Bank.get_southkorea_literacy_rate(): Get South Korea’s Adult Literacy Rate data from the World Bank.get_southkorea_life_expectancy(): Get South Korea’s Life Expectancy at Birth data from the World Bank.get_southkorea_population(): Get South Korea’s Total Population data from the World Bank.get_southkorea_unemployment(): Get South Korea’s Total Unemployment Rate data from the World Bank.get_country_info_kr(): Get key country information for South Korea.view_datasets_SouthKoreAPIs(): View available curated datasets included in SouthKoreAPIs.
These functions allow users to access high-quality and structured
information on South Korea, which can be combined with
tools like dplyr and ggplot2 to
support a wide range of data analysis, visualization, and research
tasks. In the following sections, you’ll find examples on how to work
with SouthKoreAPIs in practical scenarios.
South Korea’s GDP (Current US$) from World Bank 2022 - 2017
southkorea_gdp <- head(get_southkorea_gdp())

print(southkorea_gdp)
#> # A tibble: 6 × 5
#>   indicator         country      year   value value_label
#>   <chr>             <chr>       <int>   <dbl> <chr>
#> 1 GDP (current US$) Korea, Rep.  2022 1.67e12 1,673,916,511,800
#> 2 GDP (current US$) Korea, Rep.  2021 1.82e12 1,818,432,106,880
#> 3 GDP (current US$) Korea, Rep.  2020 1.64e12 1,644,312,831,906
#> 4 GDP (current US$) Korea, Rep.  2019 1.65e12 1,651,422,932,448
#> 5 GDP (current US$) Korea, Rep.  2018 1.73e12 1,725,373,496,825
#> 6 GDP (current US$) Korea, Rep.  2017 1.62e12 1,623,074,183,502
South Korea’s Life Expectancy at Birth from World Bank 2022 - 2017
southkorea_life_expectancy <- head(get_southkorea_life_expectancy())

print(southkorea_life_expectancy)
#> # A tibble: 6 × 4
#>   indicator                               country      year value
#>   <chr>                                   <chr>       <int> <dbl>
#> 1 Life expectancy at birth, total (years) Korea, Rep.  2022  82.7
#> 2 Life expectancy at birth, total (years) Korea, Rep.  2021  83.5
#> 3 Life expectancy at birth, total (years) Korea, Rep.  2020  83.4
#> 4 Life expectancy at birth, total (years) Korea, Rep.  2019  83.2
#> 5 Life expectancy at birth, total (years) Korea, Rep.  2018  82.6
#> 6 Life expectancy at birth, total (years) Korea, Rep.  2017  82.6
South Korea’s Total Population from World Bank 2022 - 2017
southkorea_population <- head(get_southkorea_population())

print(southkorea_population)
#> # A tibble: 6 × 5
#>   indicator         country      year    value value_label
#>   <chr>             <chr>       <int>    <int> <chr>
#> 1 Population, total Korea, Rep.  2022 51672569 51,672,569
#> 2 Population, total Korea, Rep.  2021 51769539 51,769,539
#> 3 Population, total Korea, Rep.  2020 51836239 51,836,239
#> 4 Population, total Korea, Rep.  2019 51764822 51,764,822
#> 5 Population, total Korea, Rep.  2018 51585058 51,585,058
#> 6 Population, total Korea, Rep.  2017 51361911 51,361,911
Evolution of Births in Seoul by Age Group
# Filter data for a specific region, e.g., "Seoul"
births_seoul <- SouthKoreaBirths_tbl_df %>%
  filter(region == "Seoul") %>%
  group_by(time, age) %>%
  summarise(total_births = sum(births), .groups = "drop")

# Plot the evolution of births by age group in Seoul
ggplot(births_seoul, aes(x = time, y = total_births, color = age)) +
  geom_line(size = 1) +
  labs(
    title = "Evolution of Births in Seoul by Age Group",
    x = "Year",
    y = "Total Births",
    color = "Age Group"
  ) +
  theme_minimal()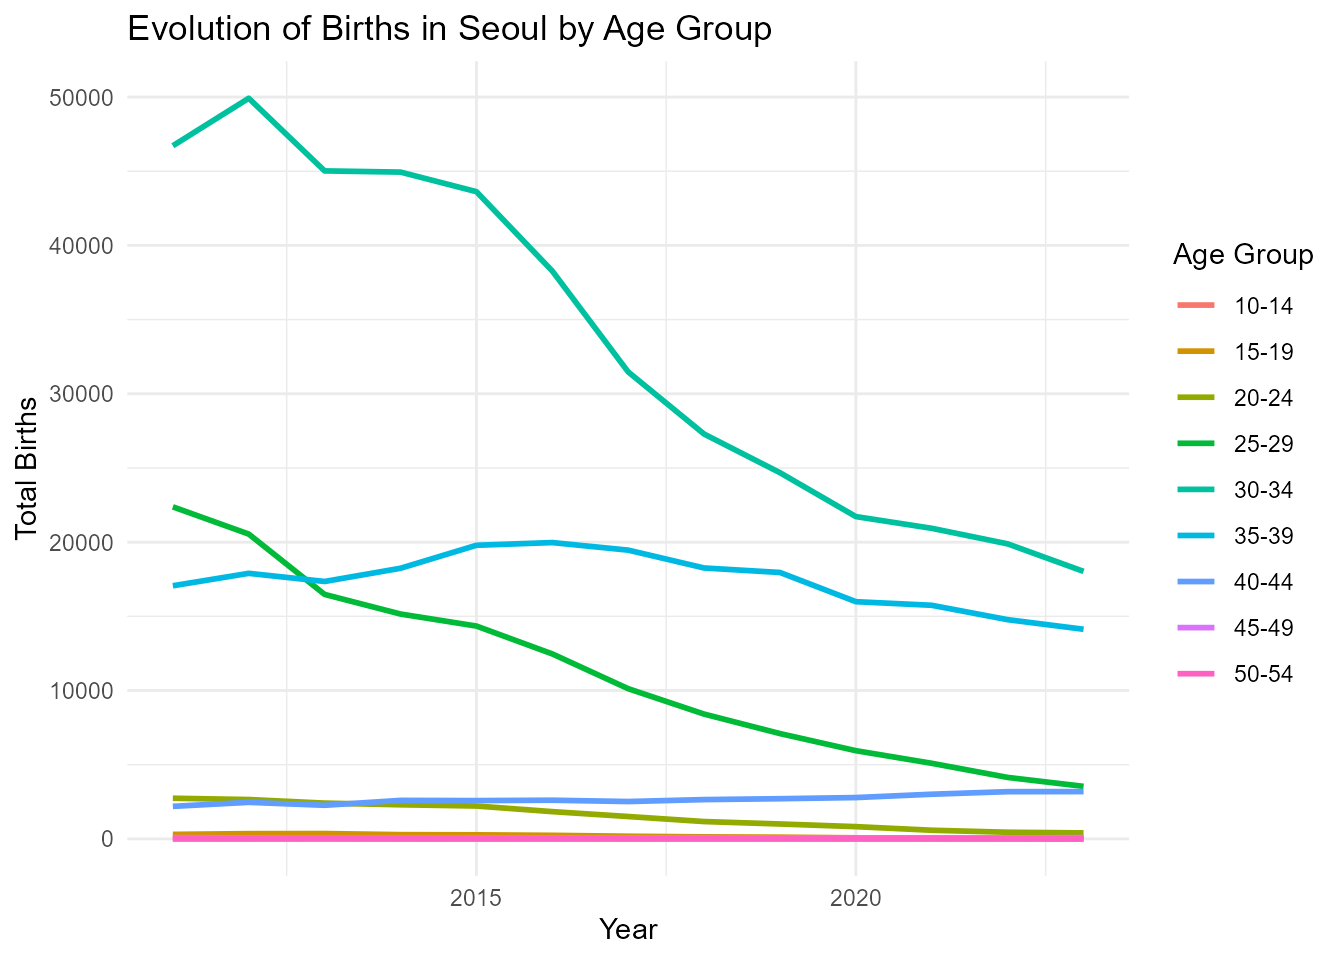
Dataset Suffixes
Each dataset in SouthKoreAPIs is labeled with a
suffix to indicate its structure and type:
_df: A standard data frame._tbl_df: A tibble data frame object._list: A list object._sf: A sf (Simple Features) object.
Datasets Included in SouthKoreAPIs
In addition to API access functions, SouthKoreAPIs
offers one of the largest curated collections of open datasets focused
on South Korea. These preloaded datasets cover a wide
range of topics including public health outbreaks, demographics, social
surveys, elections, economic indicators, natural disasters,
administrative divisions, air quality, climate data, energy consumption,
cultural information, and financial markets. Below are some featured
examples:
MERSKorea2015_list: A list containing two data frames with information collected during the first weeks of the 2015 MERS-CoV outbreak in South Korea.
KoreanSocialSurvey_tbl_df: A tibble containing a sample of data from the Korean General Social Survey (KGSS) conducted in 2023.
SeoulMosquito_tbl_df: A tibble containing daily mosquito indicator data and weather measurements for Seoul, South Korea, from 2016 to 2019.
Conclusion
The SouthKoreAPIs package offers a unified interface for
accessing both real-time data from public APIs and a rich collection of
curated datasets about South Korea. Covering a wide
range of topics from economic indicators, public holidays, and
demographic statistics via international APIs, to detailed datasets on
public health outbreaks, elections, natural disasters, climate data,
energy consumption, and more, SouthKoreAPIs provides users
with reliable, structured, and high-quality data.
Unlike tools that focus exclusively on API access,
SouthKoreAPIs includes one of the most comprehensive
collections of preloaded open datasets related to South
Korea, enabling deeper exploration of the country’s historical,
social, and economic landscape.
Designed to support reproducible research, education, and data journalism, the package empowers users to analyze and visualize South Korea–focused data directly within R, using tidy data formats and well-documented sources.