
agridatasets: A Comprehensive Collection of Agricultural and Agronomic Datasets
Source:vignettes/agridatasets.Rmd
agridatasets.Rmd
library(agridatasets)
library(dplyr)
#>
#> Attaching package: 'dplyr'
#> The following objects are masked from 'package:stats':
#>
#>     filter, lag
#> The following objects are masked from 'package:base':
#>
#>     intersect, setdiff, setequal, union
library(ggplot2)
Introduction
The agridatasets package offers a rich and diverse
collection of datasets focused on agriculture, animal production, plant
pathology, soil science, and applied agronomic experimentation. It
includes comprehensive data on topics such as crop yield and
growth, plant breeding trials, soil properties and land suitability,
pest and disease infestation, herbicide and pesticide efficacy, animal
reproduction and weight gain, seed germination, and classical
experimental designs used in agricultural research.
The package contains a wide variety of data types, including field trial data, greenhouse and laboratory experiments, longitudinal growth measurements, animal husbandry records, soil composition and classification data, and production/market datasets. These datasets encompass crop performance under different treatments and cultivars (rice, wheat, corn, soybean, coffee, cotton, eucalyptus, willow, apple, grape, strawberry, tomato, carrot, and other species), livestock and poultry data (cattle, pigs, sheep, ducks, guinea pigs, and broilers), soil munsell color and mineral properties, pesticide and fungicide dose-response trials, classical split-plot and Latin square experimental designs, and coffee production and land suitability assessments across arabica and robusta varieties.
All datasets within agridatasets
view_datasets_agridatasets()
#>  [1] "alfalfa_soil"             "apple_canker"
#>  [3] "apple_uniformity"         "arabica_soil"
#>  [5] "arabica_temp"             "arabica_terrain"
#>  [7] "arabica_water"            "avocado_us_sale"
#>  [9] "bamboo_growth"            "biological_control"
#> [11] "bird_grazing"             "black_duck_survival"
#> [13] "blackgrass_herbicide"     "broiler_growth"
#> [15] "budworm_pyrethroid"       "carrot_fly_infestation"
#> [17] "carrot_insecticide"       "cattle_butterfat"
#> [19] "cauliflower_growth"       "coffee_composition"
#> [21] "coffee_production"        "cork_tree_direction"
#> [23] "corn_hybrid_density"      "cotton_pesticide"
#> [25] "cowpea_maize_yield"       "cows_insemination"
#> [27] "earthworm_crop_soils"     "earthworm_population"
#> [29] "eelworm_fumigation"       "egg_weight_daily"
#> [31] "eucalyptus_progenies"     "fish_feeding"
#> [33] "fungicide_latin_square"   "grape_uniformity"
#> [35] "guinea_pig_sleep"         "hawaii_plant_size"
#> [37] "hawaii_tree_growth"       "idn_rice_farms"
#> [39] "kiwi_crop_design"         "ladybird_fungus"
#> [41] "lamb_births"              "nitrofen_toxicity"
#> [43] "orange_rootstocks"        "peach_uniformity"
#> [45] "pig_weight_gain"          "plant_growth_regulator"
#> [47] "pollen_removal"           "potato_scab_sulfur"
#> [49] "rabbit_body_mass"         "red_wine_quality"
#> [51] "rice_wheat_production"    "river_deforestation"
#> [53] "robusta_soil"             "robusta_temp"
#> [55] "robusta_terrain"          "robusta_water"
#> [57] "seed_germination"         "soil_munsell_colors"
#> [59] "soil_munsell_minerals"    "soybean_cultivars"
#> [61] "strawberry_cross_disease" "strawberry_yield"
#> [63] "timber_genetics"          "tomato_insecticides"
#> [65] "tomato_uniformity"        "toxin_lethal_dose"
#> [67] "turnip_density"           "us_state_soils"
#> [69] "wheat_bunt"               "wheat_splitsplit"
#> [71] "willow_cutting_yield"
Example Datasets
Below are selected example datasets included in the
agridatasets package:
bamboo_growth: Bamboo shoot growth measurements across compartments and transects.rice_wheat_production: Historical rice and wheat area, production, and yield statistics.cattle_butterfat: Butterfat content in cattle by breed and age.
Data Visualization with agridatasets Data
Old vs New Bamboo Shoots by Compartment
# Summarize average shoot counts by Compartment using base R + dplyr
summary_data <- bamboo_growth %>%
  dplyr::group_by(Compartment) %>%
  dplyr::summarise(
    Old_Shoots = mean(Old_Shoots, na.rm = TRUE),
    New_Shoots = mean(New_Shoots, na.rm = TRUE)
  ) %>%
  as.data.frame() %>%
  reshape(
    varying = c("Old_Shoots", "New_Shoots"),
    v.names = "Value",
    timevar = "Shoot_Type",
    times = c("Old_Shoots", "New_Shoots"),
    direction = "long"
  ) %>%
  dplyr::select(Compartment, Shoot_Type, Value)

# Create a grouped bar chart
ggplot(summary_data, aes(x = factor(Compartment), y = Value, fill = Shoot_Type)) +
  geom_col(position = "dodge", color = "white") +
  scale_fill_manual(values = c("Old_Shoots" = "lightblue", "New_Shoots" = "darkred")) +
  labs(
    title = "Average Old vs New Bamboo Shoots by Compartment",
    x = "Compartment",
    y = "Average Number of Shoots",
    fill = "Shoot Type"
  ) +
  theme_minimal() +
  theme(axis.text.x = element_text(angle = 45, hjust = 1))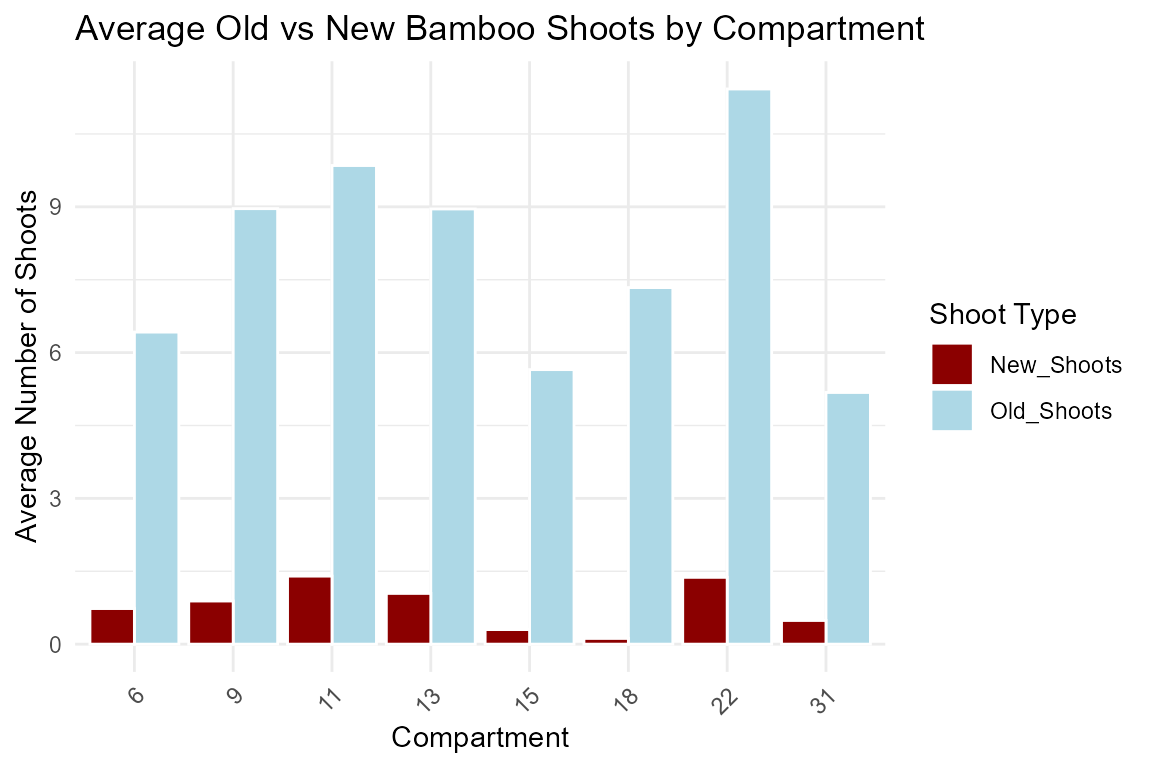
Rice vs Wheat Yield Over Time
# Extract the starting year as numeric for correct chronological ordering
plot_data <- rice_wheat_production %>%
  dplyr::mutate(
    Year_num = as.numeric(substr(as.character(Year), 1, 4))
  ) %>%
  dplyr::arrange(Year_num)

# Create a line plot comparing Yield trends for Rice and Wheat
ggplot2::ggplot(plot_data, ggplot2::aes(x = Year_num, y = Yield, color = Food)) +
  ggplot2::geom_line(linewidth = 1) +
  ggplot2::geom_point(size = 1.5, alpha = 0.7) +
  ggplot2::scale_color_manual(values = c("Rice" = "darkgreen", "Wheat" = "goldenrod")) +
  ggplot2::labs(
    title = "Rice vs Wheat Yield Over Time",
    x = "Year",
    y = "Yield (kg/hectare)",
    color = "Crop"
  ) +
  ggplot2::theme_minimal() +
  ggplot2::theme(axis.text.x = ggplot2::element_text(angle = 45, hjust = 1))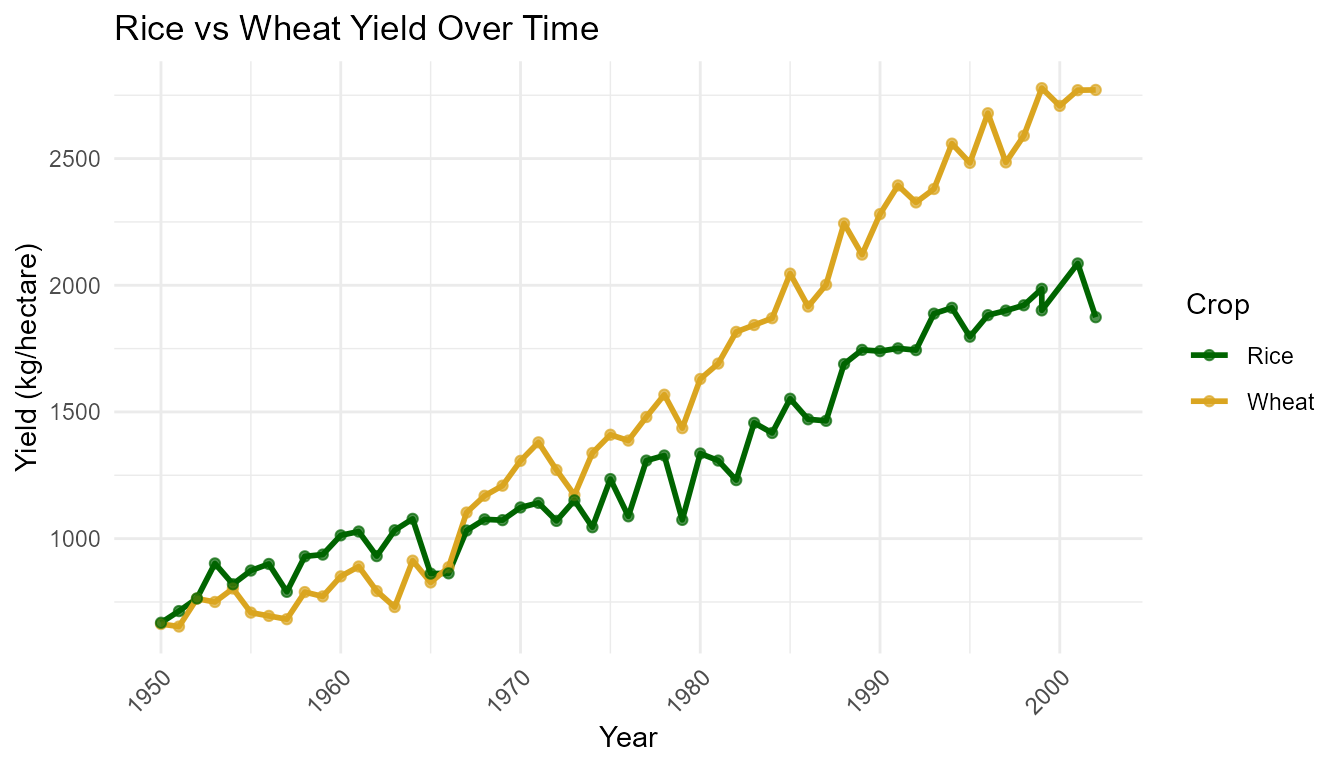
Butterfat Content by Breed and Age
# Create a boxplot comparing Butterfat content across Breed, split by Age
ggplot2::ggplot(cattle_butterfat, ggplot2::aes(x = Breed, y = Butterfat, fill = Age)) +
  ggplot2::geom_boxplot(outlier.color = "black", outlier.size = 1.5) +
  ggplot2::scale_fill_manual(values = c("2year" = "lightblue", "Mature" = "darkred")) +
  ggplot2::labs(
    title = "Butterfat Content by Cattle Breed and Age",
    x = "Breed",
    y = "Butterfat (%)",
    fill = "Age"
  ) +
  ggplot2::theme_minimal() +
  ggplot2::theme(axis.text.x = ggplot2::element_text(angle = 45, hjust = 1))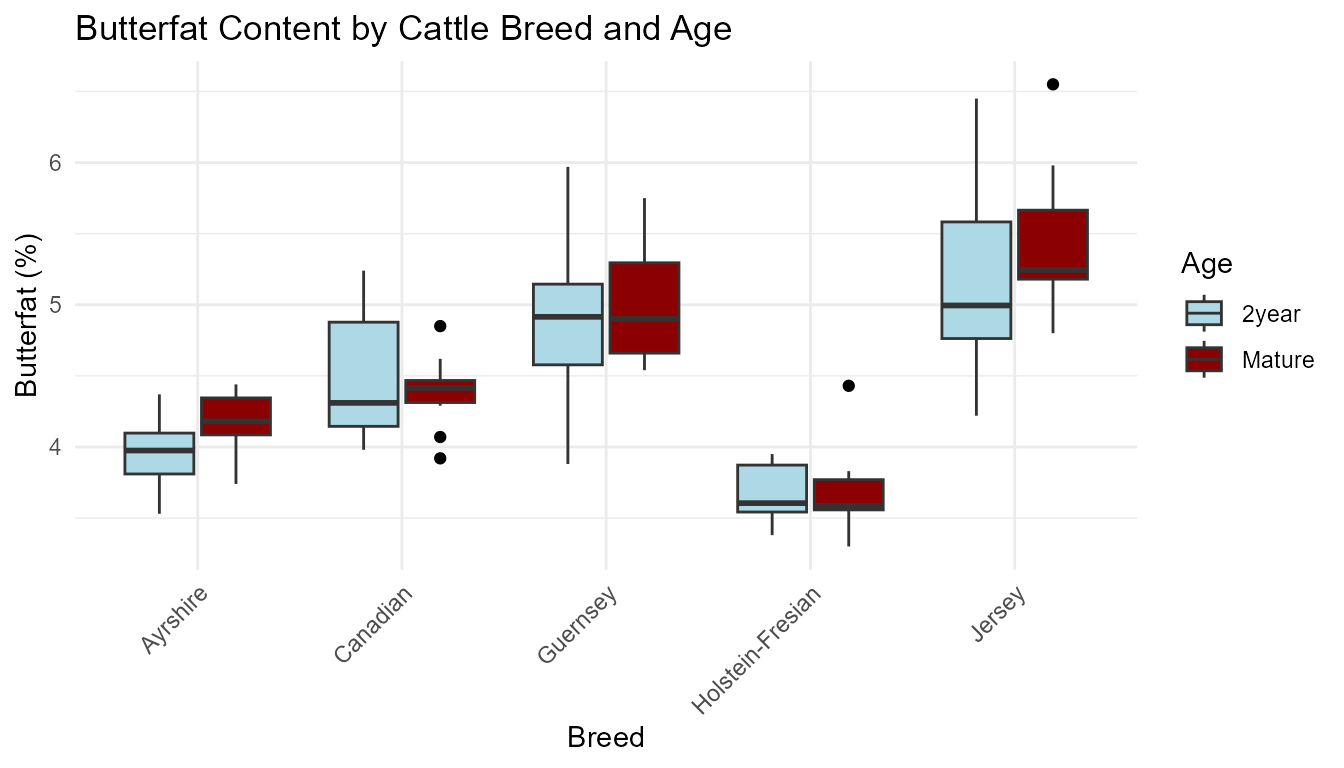
Conclusion
The agridatasets package offers a comprehensive and
curated collection of datasets spanning a wide spectrum of agricultural,
agronomic, and animal science domains. By integrating data from
classical field trial designs, plant breeding programs, soil science
surveys, livestock and poultry records, pest and disease studies, and
international production statistics, this package provides researchers
with robust resources for applied agricultural research.
Whether you are conducting exploratory data analysis, building
predictive and yield models, testing statistical hypotheses, teaching
experimental design, or exploring crop and livestock performance across
regions and treatments, agridatasets delivers
well-structured, documented, and diverse datasets that reflect the
complexity of modern and historical agricultural systems.